America's affordable housing shortfall presses older adults from both sides: renters priced out of their communities, and homeowners straining to keep the homes they already own. Our research map, The Rooms Already Exist, shows that the housing to fix this is already built, held peer to peer by older adults themselves. This companion answers the next question: what is connecting those rooms actually worth, in dollars?
How the Numbers Add Up, Nationally.
Before you pick a calculator, here is the national picture: who is paying too much, what already sits unused, and what connecting the two is worth. Then see the same math in your state, or at your own kitchen table.
Paying Too Much
12.2M
Older-adult households spend more for housing than is recommended: 4.5 million renting, 7.7 million owning.
Source: ACS 2023 1-Year (PUMS; B25093)
A Year of Idle Capacity
$211B/yr
A year of rental value sitting in 35 million spare bedrooms owned by older adults.
Source: 35.1M rooms x $500/mo HUD-based room rent. Illustration of scale
The Subsidy Bill
$62.7B/yr
A year of taxpayer subsidy to house every cost-burdened older renter with vouchers. Matches meet that need rent-to-rent.
Source: 4.48M renters x HUD's ~$14,000 avg subsidy. Illustration of scale
Kept by Renters
$37.6B/yr
A year of rent older renters keep by sharing instead of renting alone.
Source: 4.48M renters x $700/mo platform avg savings. Illustration of scale
The Need Has Two Sides.They Are Each Other's Solution.
The homeowner strained by taxes, insurance, and upkeep holds the room; the renter priced out of her community needs it. Everything on these pages measures what happens when they find each other, at two altitudes. Pick your seat.
The State Math
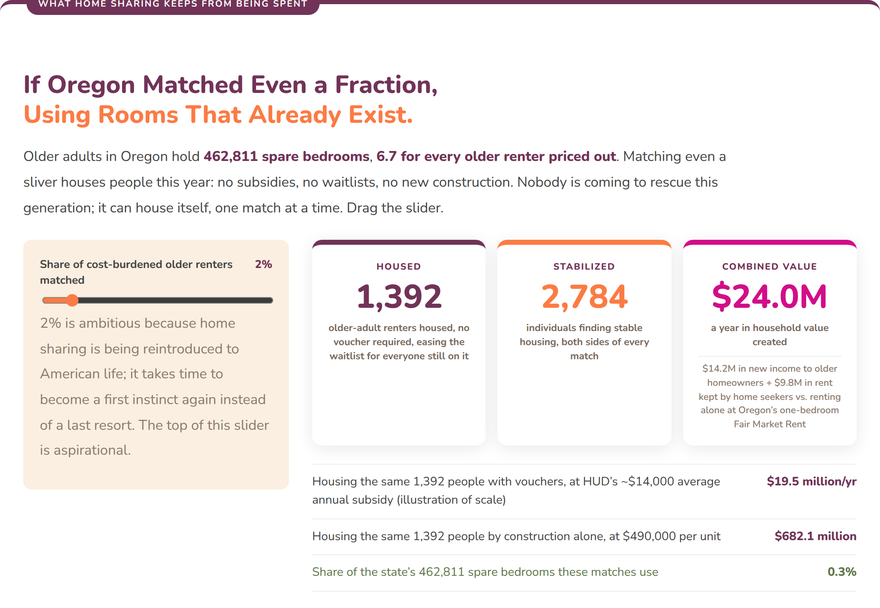
What the Shortfall Costs. What Sharing Keeps.
What the housing shortfall already costs your state, and what home sharing keeps from being spent: older adults housed without vouchers, waitlists, or construction dollars, at a delivery cost measured in cents per resident.
Who this calculator is for
State agencies and legislators, budget and aging leaders, Area Agencies on Aging, funders, and housing partners weighing home sharing as infrastructure.
Your Household Math
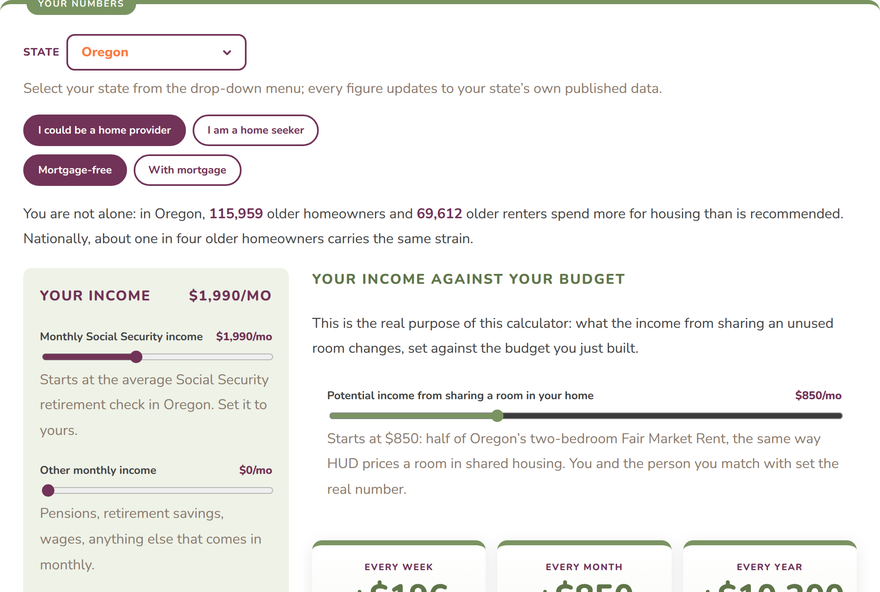
What a Spare Room Changes at Home.
Stretching a fixed income is hard, and it is getting harder. Every month of hard choices means smaller meals, fewer evenings out, and repairs put off again. See what the income from sharing a spare room changes, measured against your real budget: preset to your state, sliders for your life.
Who this calculator is for
Home providers with a room to share, home seekers looking for an affordable home, and the families and advisors helping them decide.
TL;DR
Home sharing is a financial intervention as much as a housing one, and it pays on both sides of the door at once. For households, one match closes the gap between a Social Security check and what life actually costs. For states, matches house people this year at a fraction of a cent on the construction dollar. The rooms exist, the people exist, and the math already works; what's missing is the infrastructure to connect them.
Home sharing is for anyone. There are no age or income requirements, and people of every generation and circumstance share homes on the HomeShare Online platform. HomeShare focuses its research on older adults because their need is most acute: the fastest-growing group experiencing homelessness in America, with the fewest affordable options, and the very generation holding the rooms that could solve it.
Why We Focus on Older Adults
They hold the rooms
The deepest pool of ready housing in the country already sits inside homes they own, room by spare room.
They want to stay
Three-quarters of adults over 65 want to age in the home they already live in, not leave it.
Their need is growing fastest
Homelessness among older renters is rising faster than in any other group, and they have the fewest affordable options.
They are each other's answer
One holds the room, one needs it. A match connects them, with no subsidy, waitlist, or construction dollar in between.
Citations, Definitions & SourcesOpen the fine printClose the fine printEvery figure on this page traces to a published source. The full citations, definitions, and source tables are available by clicking Open the Fine Print.
Numbered Citations
- U.S. Census Bureau, ACS 2023 1-Year (PUMS; Table B25093), via The Rooms Already Exist.
- 35.1M spare bedrooms (ACS PUMS) x $500/month room rent (see Definitions: HUD FY2026 Low HOME Rent for a three-bedroom home divided by three, population-weighted nationally, $508, rounded to $25). Illustration of scale.
- 4.48M cost-burdened older renters x HUD's ~$14,000 average annual voucher subsidy. Illustration of scale.
- 4.48M cost-burdened older renters x $700/month (HomeShare Online program measurement). Illustration of scale.
Definitions
A match. One home sharing arrangement: a home provider who shares a room in a home they own or rent, and a home seeker who lives in it. Rent and terms are always set by the two people themselves.
Cost-burdened. Paying more than 30 percent of household income for housing, the federal affordability threshold, applied to gross rent for renters and selected monthly owner costs for homeowners. Counts are households with a householder aged 65 or older.
Spare bedroom. In an owner-occupied home with a householder 65 or older: total bedrooms minus household members, floored at zero. Possible capacity inside an occupied home, not proof a room sits empty.
The Elder Index. The Elder Economic Security Standard Index, built and maintained by the Gerontology Institute at the University of Massachusetts Boston: the income a one-person older-adult household needs to meet basic needs, priced by state and housing situation. 2025 values used throughout, with attribution. The Elder Index is a trademark of UMass Boston; explore it at elderindex.org.
Room rent. HomeShare encourages home providers to offer rooms at affordable-housing cost, not market rent, and prices a room by HUD's own rules: HUD’s affordable rent for a three-bedroom home (the Low HOME Rent, set at 50 percent of area median income, 24 CFR 92.252(b)), divided by its three bedrooms, the pro-rata share HUD applies to shared housing (24 CFR 982.617), rounded to $25. Nationally that is about $500 a month; in Oregon, $475. Where the size of the home is known, the calculators pro-rate that home instead: one room in a two-bedroom home is half the two-bedroom rent. Every calculator treats the figure as a starting point with a slider, never a rule; the two people in a match set the rent.
Sources & Attributions
All figures on this page and both calculators trace to the sources below; each calculator page carries its own methodology notes. Dollar figures labeled "illustration of scale" are direct multiplication of cited primitives and are presented to size the opportunity, not as budget forecasts.
| Source | Used for |
|---|---|
| U.S. Census Bureau, ACS 2023 1-Yr PUMS; Table B25093 | Cost-burdened older-adult renters and homeowners; spare bedrooms (via The Rooms Already Exist). |
| Elder Index 2025, Gerontology Institute, UMass Boston | Economic security budgets by state and housing situation, with category detail. |
| SSA Annual Statistical Supplement 2025, Table 5.J6 | Average Social Security retired-worker benefit by state (Dec 2024). |
| NLIHC Out of Reach 2025 (HUD Fair Market Rents) | State one-bedroom rents; the cost of renting alone. |
| U.S. Census Bureau, ACS 2024 1-Yr (B25103; B25077) | Median property taxes; median home values. |
| Zillow Home Value Index, condo/co-op, June 2026 (Zillow Research) | Typical state condo value in the down-sizing comparison. |
| CareScout (Genworth) Cost of Care Survey 2025 | Assisted living monthly medians; in-home care hourly rates. |
| HUD; CBPP; NLIHC | Voucher subsidy average; rental assistance coverage and waits. |
| National Alliance to End Homelessness | Public cost of an older adult falling out of housing. |
| Terner Center (2024); WSHFC (FY2024-25); Portland City Budget Office (2022); NCSHA/Abt (2018) | Per-unit affordable development costs. |
| City of Portland Home Sharing Pilot (Portland Housing Bureau) | $250/week affordability ceiling including utilities and fees; the room-rent benchmarks sit below it. |
| USAging/ACL; Census Vintage 2025 | Area Agencies on Aging counts; state populations. |
| HomeShare Online program measurements | $700 average monthly seeker savings; platform enrollment history. |
Companion research: The Rooms Already Exist (the supply data), Home Sharing: The Missing Link Between Aging and Housing Policy (the policy argument), and Before the Move (the years when housing pressure compounds).
Cite This Paper
HomeShare Online. (2026). The Value of a Match: The Economics of Home Sharing, State by State. https://homeshareoregon.org/research/value-of-a-match/
About HomeShare Online
HomeShare Online publishes this paper as students of aging, housing, and community infrastructure. We operate one of many possible interventions in the missing middle. We believe the most useful contribution we can make to the larger field is to add a frame and a research agenda, rather than to argue for our particular role within it.
If you are working on related questions, we would like to hear from you. Email the executive director at executivedirector@homeshareoregon.org.